


Introduction
As artificial intelligence (AI) systems become more sophisticated, they can handle larger data sets and discover novel patterns that human analysts might not have either the experience or knowledge to discover. A human analyst might, throughout a lifetime, gain experience of a few hundred cases, while an AI system could gain experience of many million cases within a few hours.
Not only can the AI system have greater experience of a domain than a human, but it can also create more nuanced analyses of that domain. However, it is important to note that all of the application domains in which AI systems are being proven involve well-defined problem spaces. These include game-playing (board games such as Go and video games such as Atari games) and image analysis.
In game-playing, AI systems regularly outperform human experts. Performance on image analysis is, to date, less clear cut.
Typically, the problem space for the AI system involves either classifying images by discovering salient features or developing strategies for game-playing. Certainly, in game-playing, AI systems regularly outperform human experts. Performance on image analysis is, to date, less clear cut.
A striking aspect of game-playing AI systems is their ability to generate ‘moves’ (in the game) that can be inexplicable to human observers. The challenge for interpretable (and explainable) AI lies in aligning the understanding and expectations of human observers/consumers of the output of the AI system to the performance of these systems.
Post-hoc analysis of the AI system
Post-hoc analysis of the AI system’s activity can provide the basis for humans to infer its strategy.
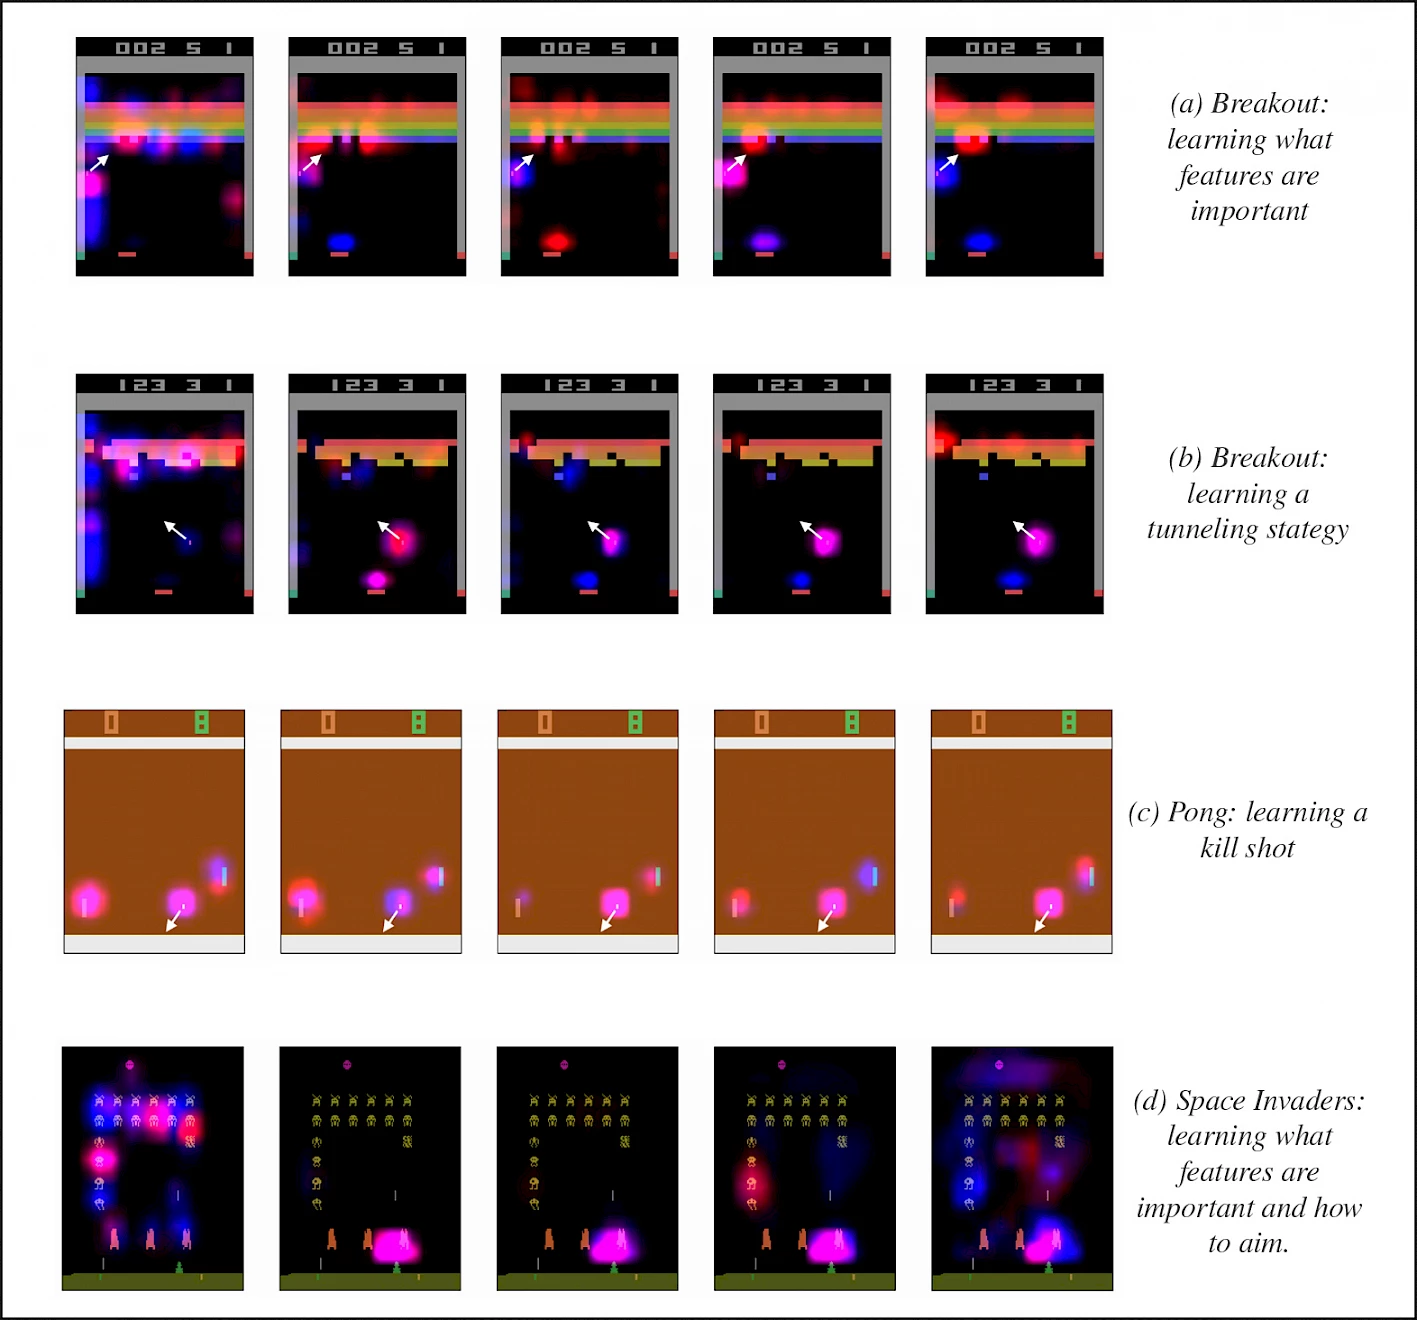
For game-playing AI, a popular approach to explanation involves the use of saliency maps (see Figure 1 below) to illustrate the state of the game before and after a move by the AI system. These provide a visual representation of the ways in which the AI system activity changes the state of the game. By analogy, one could imagine saliency maps (or similar) being used to illustrate state changes in other domains. While these approaches are popular, and users find them intuitive to interpret, they create a problem of aligning the actual strategy of the AI system with the inferences made by humans. This could result in misconceptions about how the AI system is behaving.
Questions from system developers answered
How do the users of visual feedback from AI systems make sense of the information this contains?
Local models can support interpretation. By extracting only those features that the AI is using for its recommendation, it is possible to highlight salient features for that model.
These approaches, such as Local Interpretable Model-Agnostic Explanations (LIME), can allow users to focus on specific features that are important for the output. Presenting a subset of features will not exceed the limited working memory capacity of users (typically assumed to be between five to nine features, or four to six ‘chunks’ if the features can be clustered into meaningful groups).
Further, presenting a subset of features can allow the user to generate a narrative as to why these (rather than other features) were used. This points to one of the problems with this approach: people can be very good at generating post hoc rationalisation for any combination of features (particularly if the rationalisation fits a preferred narrative that they have imagined before the analysis).
This could mean that, rather than objectively responding to the output of the AI system, people could use this to confirm their own biases and expectations. A further problem is that generating local models can mean that the output is not capable of being generalised to either a global model or other local models.
How do users of AI systems create explanatory models or narratives to help them interpret the output?
If it is possible, provide an overview or dashboard of the salient features that the AI system uses. An alternative approach (to the use of LIME and related approaches) might be to use adversarial neural networks to challenge outcomes to discover a set of features that discriminate models. Elaborating the dashboard to create clusters of these features (see Figure 2 below) could be useful in identifying patterns and trends.
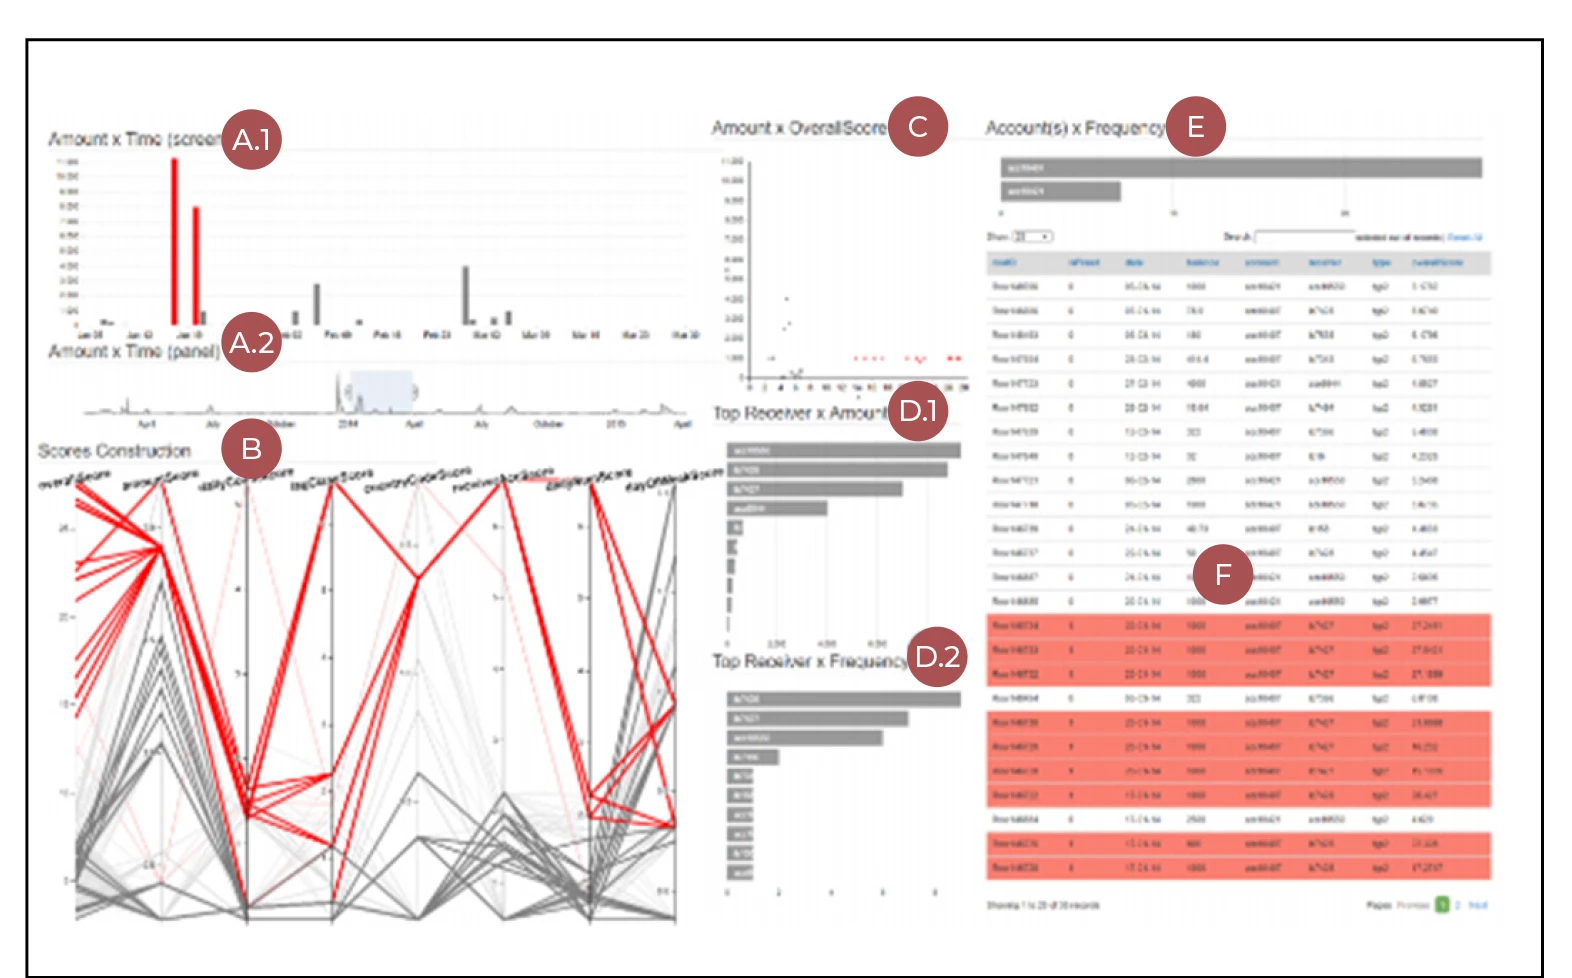
Figure 2.
Screenshot of EVA (Event detection with Visual Analytics). (A.1, A.2) Temporal Views: a filler was applied in (A.2) to the period from January 2014 until April 2014). (B) Score Construction View: each line represents a transaction and its scores. (C) Amount vs Overall Score Scatterplot. (D.1, D.2) Ranks of accounts that received the highest amounts of money from the selected account. (E) Accounts Selector: bars shows the amount of transactions from each account. (F) Dynamic Table of raw transaction data. In all views, elements that represents suspicious data are highlighted in red.
How can you help users recognise patterns and trends in features used by AI systems?
Where possible, allow analysts to work with counterfactual or ‘what-if’ analysis to test the sensitivity of models to features. If possible, indicate which rules are being met or breached for combinations of features.
This could allow – even without retraining data in response to changes in situations – analysts to appreciate how features interact or to predict what might happen if some of the features are modified. In this case, the aim is to not simply provide an output but also to show what would happen if one or more features changed. For example, a bank loan might be refused by an AI system; if the applicant was able to ask, ‘what if my outgoings were reduced by £x?’, this counterfactual questioning could allow the model to be evaluated.
Copyright Information
As part of CREST’s commitment to open access research, this text is available under a Creative Commons BY-NC-SA 4.0 licence. Please refer to our Copyright page for full details.
IMAGE CREDITS: Copyright ©2024 R. Stevens / CREST (CC BY-SA 4.0)