In recent years there has been a significant increase in the type (e.g. CCTV, UAV) and amount (e.g. open source) of information available for intelligence analysis. The analyst is asked to make sense of this ‘firehose’ of information. To do so involves reading multiple reports before making a decision about whether the collective information is significant enough to issue a security threat warning. This decision must be made as quickly as possible, lest an immediate response is required.
But each report may differ in terms of various characteristics, such as unique identifier, time, date, source, geographic location, various text fields or imagery, depending on the intelligence type. To further complicate matters, within each report some of these characteristics may indicate a high threat (e.g. the intelligence comes from a well-known and reliable actor within a terrorist group) whilst others may be less concerning (e.g. the intelligence is somewhat dated).
It is important for an analyst’s decisions to be consistent (that is, judging particular sources as high threat each time they are encountered) and unbiased (e.g. not framing the threat in such a manner that judgements about the relevance of each report is flawed). The analyst must also effectively manage external pressures due to time or situation, often whilst working in a team with other analysts, each with different opinions, backgrounds, and levels of expertise.
Unfortunately, humans are often are not very good at making rational decisions when faced with such challenges. Despite training and experience, professionals (such as intelligence analysts) often make decisions that deviate significantly from those of their peers, their own prior decisions, and from rules that they themselves claim to follow.
Errors arise primarily from noise and bias. Noise is change in judgements over time due to random factors; bias is making judgements that deviate consistently from accuracy due to cognitive processes and social environments, such as cognitive shortcuts, the demands of management and policymakers, and levels of stress and fatigue.
The potential impact of noise and bias in the intelligence context is to reduce the effectiveness of security and counter-terrorism resources (e.g. mistakenly deploying against the wrong target), damage the reputation of intelligence analysis as a field (e.g. failing to identify a terrorist threat) and, in the worst case, result in an increased likelihood of criminal and terrorist activities.
Automated decision tools can assist an analyst by providing the support necessary to make decisions that are more consistent and less biased. In addition, software tools are immune to the human stressors of the job. The tool described here, TIDE (Team Information Decision Engine), was shown to increase the effectiveness and efficiency of the individual analyst, as well as to improve group decision-making.
In addition to improving on-the-job decision-making, the software may be useful for analyst training and the development of intelligence processing standards.
How it works
The innovation described here was to embed a cognitive science-based decision-making algorithm, the Dominance-based Rough Set Approach (DRSA), within a tool developed previously under a Ministry of Defence (MOD) innovation competition in 2016.
The modification enabled an intelligence analyst’s interests and behaviour to be captured by:
- deducing relevant analyst insights from a subset of intelligence reports that could be applied to predict the relevance of unseen intelligence reports
- applying an innovative aggregation procedure to incorporate a group decision-taking facility into the tool to make it more relevant to an actual intelligence analysis team.
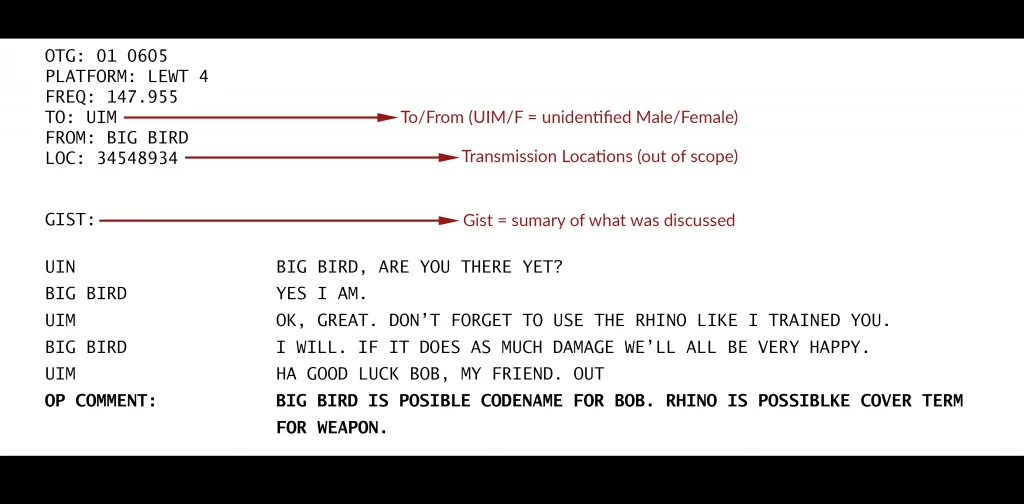
Given a set of intelligence reports it is assumed that each report contains a number of attributes, as shown in Figure 1 (in this case, a Signals Intelligence ) report, which primarily is intercepted communications of some sort). The analyst reads documents and scores them for interest. TIDE then generates rules which describe what attributes about a report make it interesting. The software processes all the reports based on those rules and ranks them in terms of whether a report contained more or less of these attributes.
A summary table is generated that shows the ‘judgement’ made by the software tool regarding the predicted risk level of each report. This table, an example of which is shown in Figure 2, describes a series of reports, which are then available to the analyst to help them decide whether or not to read any individual report.
Predictions are made on the basis of aggregate ratings for each attribute across all reports. Reports with higher scores thus can be prioritised by the analyst, and those with lower scores might purposefully not be read at all. The software is biased towards false positives, such that errors are more likely to be in the direction of predicting higher interest level so that potentially critical intelligence is not inadvertently missed. In a team context, analysts can review the scores based on their own judgements but also the judgements made by others in the team.
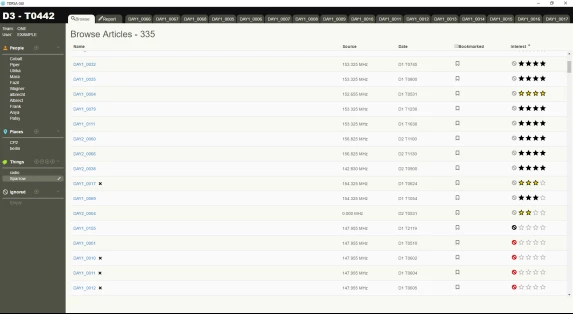
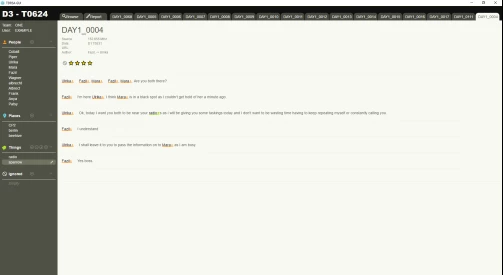
The user interface for the TIDE tool is illustrated in Figure 3. In this case, key attributes were people, places and things: keywords are specified by the analyst whilst reading through the reports or may be generated ahead of time based on previous similar reports. Items higher on the list within each category are more critical and carry more weight. The analyst can click on any report and access critical attributes (including text content). A risk level can be specified, and new search terms created as necessary.
Testing the TIDE Tool
A controlled study was run using more than 450 SIGINT reports generated within a scenario designed to describe a terrorist attack being planned in a Western European city. Study participants (postgraduate students from the University of Portsmouth and several individuals from the Defence Science and Technology Laboratory) were recruited to serve as ‘analysts.’
The reports contained information regarding terrorist planning, logistics and reconnaissance cells. In the scenario, UK interception assets had captured radio transmissions of RED (terrorist), GREEN (military police) and WHITE (civilians) organisations over a five-day period and fed their initial reports to a second line intelligence analysis cell. The SIGINT reports varied in terms of attributes (e.g. day, time, group affiliation, to/from information, transmission location); various correct and incorrect spellings of names and places; and the use of cover terms.
The majority of the reports were from GREEN and WHITE sources to increase the participant-analysts’ challenge. In the study, analysts were required to process these reports to extract intelligence pertaining to the RED plans as soon as possible.
The usefulness of the software tool was assessed for:
- the number of explicitly scored reports
- the number of attributes used
- the accuracy of assignments to risk levels (to determine how close they were to the ‘ground truth’ offered by the analyst who wrote the scenario).
Some of the analysts had access to the output of the software tool and others did not; some of the analysts with the tool received group feedback and others did not.
Results showed that analysts using TIDE, in comparison to analysts not using TIDE, scored fewer reports (18% – 22% vs 65% respectively), and that none of the TIDE analysts scored all the reports. The average processing time for analysts using TIDE was reduced by 59 minutes.
The average processing time for analysts using TIDE was reduced by 59 minutes.
Further analysis showed that the TIDE analysts were able to dismiss or filter out irrelevant reports and to target the most salient reports within about 30 minutes. Thus, there was increased efficiency for those analysts using TIDE. Analysts who deployed TIDE used slightly fewer attributes (59–84 vs 98, respectively).
For purposes of this test study, correct scores were available based on information provided by the senior intelligence expert that designed the scenario.
Therefore, the accuracy of TIDE analysts could be compared to the accuracy of analysts not using the tool. Accuracy was calculated as the ratio of ‘true positive’ and ‘true negative’ judgements to the total number of judgements made for risk levels 1–5, with 1 being low risk and 5 being high risk. Across these risk levels, accuracy scores for analysts using the software tool were 0.63–0.88, whereas those not using the tool were 0.59–0.74. Having access to group decisions further improved the performance of the TIDE analysts, whose accuracy scores were 0.66–0.92.
Impacts of noise and bias
Noise arises mainly when intelligence analysts make decisions that deviate significantly from their own prior decisions. Noise errors were identified by assessing the scores successively provided by an analyst in different time points during the same work session. Bias errors were assessed by analysing the scores provided by an analyst in a given time point with the actual score of the report.
The metric used here was Kendall’s τ (tau), a non-parametric statistic that reflects the association among variables. If Kendall’s τ is 1, there is no noise or bias errors over time. If Kendall’s τ is 0, there is no overall trend of scores, and scores may be regarded as essentially random. Intermediate values of Kendall’s τ indicate a greater or lesser degree of unanimity among the scores.
An analysis of noise errors for analysts not using the tool showed Kendall’s τ = 0.55; for those using the tool without group feedback, τ = 0.68; and for those using the tool with group feedback, τ = 0.88–0.92. An analysis of bias errors for analysts not using the tool showed Kendall’s τ = 0.44; for those using the tool without group feedback, τ = 0.66; and for those using the tool with group feedback, τ = 0.70–0.87.
Conclusion
In summary, the study findings showed that the TIDE tool made a statistically significant difference by enabling analysts to identify a greater proportion of relevant reports (i.e. RED) and filter out irrelevant reports (i.e. WHITE and GREEN). In comparison, the non-TIDE analysts wasted time looking at a greater proportion and number of irrelevant reports. In addition, the TIDE group extracted more accurate intelligence and worked more effectively within a team of analysts assessing the same data.
Potential usefulness
The TIDE tool could be used to:
- Improve decision making
By being embedded as a decision aide alongside existing intelligence analysis tools to provide feedback on the consistency of the analysts’ judgements. - Inform training practices
By capturing what behaviours drive different judgements between analysts. For example, what attributes (factors) do ‘good’ analysts use to make their decisions? - Inform new standards for intelligence processing
For example, the new standards to be drawn up by the College of Policing – by providing an objective and quantifiable method whereby the decisions of novice analysts can be evaluated against the judgements made by analysts with greater experience and expertise. - Assess the extent to which individual decision
making is influenced by collective decisions made by the rest of a group. Previous research has shown the dangers of ‘groupthink’ and the need for cognitive flexibility.
Read more
- Adame B.J. (2016). Training in the mitigation of anchoring bias: A test of the consider-the opposite strategy. Learning and Motivation, 53, 36–48.
- Chakhar, S., Ishizaka, A., Labib, A. & Saad, I. (2016). Dominance-based Rough Set Approach for Group Decisions. European Journal of Operational Research, 251:206–224.
- Hammond, J. S., Keeney, R. L. & Raiffa, H. (2006). The hidden traps in decision making. Harvard Business Review, 84, 118–126.
- Heuer Jr., R.J. (1999). Psychology of intelligence analysis. Washington, DC: Central Intelligence Agency, Center for the Study of Intelligence.
- Kahneman, D. & Rosenfield, A.M. (2016). Noise: How to overcome the high, hidden cost on inconsistent decision making. Harvard Business Review, 94/10, 38–46.
- Reyna V.F., Chick, C.F., Corbin, J.C. & Hsia, A.N. (2014). Developmental Reversals in Risky Decision Making: Intelligence Agents Show Larger Decision Biases Than College Students. Psychical Science, 25(1): 76–84.
Copyright Information
As part of CREST’s commitment to open access research, this text is available under a Creative Commons BY-NC-SA 4.0 licence. Please refer to our Copyright page for full details.
IMAGE CREDITS: Copyright ©2024 R. Stevens / CREST (CC BY-SA 4.0)
